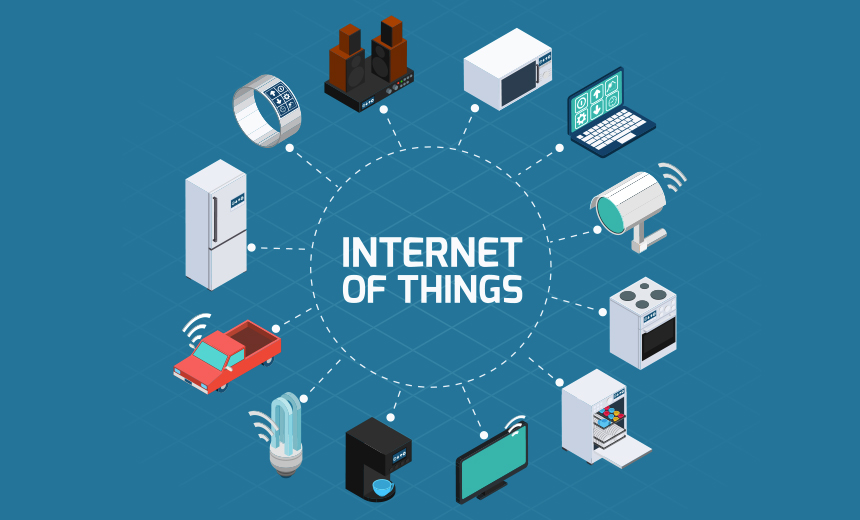
Computer Industry Almanac
Computer Industry Almanac Home
Market Research Reports
Computer & Internet Industry Almanacs
Press Releases
Links & Information
About Us
Order
Contact Information


Computers-in-Use by Country

Detailed Table of Contents and Illustrations

   
Historical estimates and forecast of the number of PCs-in-use and total computers-in-use for over 50 countries. The table of content of the report is shown below:
   
1.1 Introduction and Definitions
1.2 What is Included in the Computers-in-Use Forecast?
1.3 What is Included in the PCs-in-Use Forecast?
1.4 PC Market Perspectives
1.5 Computers-in-Use Summary Data
2.1 Forecast Methodology and Assumptions
2.2 Forecast Methodology
2.3 Internet Hardware Platforms
3.1 Computers-in-Use by Country
3.2 Leading Countries by Number of Computers-in-Use
3.3 Leading Countries by Number of Computers-in-Use per Capita
3.4 PCs-in-Use by Country
3.5 Leading Countries by Number of PCs-in-Use
3.6 Leading Countries by Number of PCs-in-Use per Capita
4.1 Forecast Spreadsheet Printout
   
   
The next table shows all the information that is available in the Computers-in-use forecast for over 50 countries and six regions.
   
Information Available
Population
Computers-in-use
Computers-in-use growth
Computers-in-use share
Computers-in-use per 1,000 people
PCs-in-use PCs-in-use growth
PCs-in-use share
PCs-in-use per 1,000 people
Other computers-in-use
Other computers-in-use growth
Other computers-in-use share
Other computers-in-use per 1,000 people
   
Regions
  North America
South/Central America
W. Europe
E. Europe
Middle East/Africa
Asia/Pacific


Years
 
1990
1991
1992
1993
1994
1995
1996
1997
1998
1999
2000
2001
2002
2003
2004
2005

2006
2007
2008
2009

2010

2011

2012


Countries
 

Argentina
Australia
Belgium
Brazil
Bulgaria
Canada
Chile
Colombia
Czech Republic
Denmark
Finland
France
Germany
Greece
Hong Kong
Hungary
Iceland

India
Indonesia
Ireland
Israel
Italy
Japan
Malaysia
Mexico
Netherlands
New Zealand
Norway
Peru
Philippines
Poland
Portugal
Romania
Russia
Saudi Arabia
Singapore
Slovakia
South Africa
South Korea
Spain
Sweden
Switzerland
Taiwan
Thailand
Turkey
Ukraine
United Kingdom
USA
Venezuela
Worldwide


The price of the single user version of this report is $1,850. A site license or multi-user version of this report is $3,000. The report can be sent via email as a MS Word document and an Excel spreadsheet. The spreadsheet forecast can be modified, as additional data becomes available. Updated yearly.
   
Methodology
 
Order
 
P.O. Box 53, Arlington Heights, IL 60006  847-758-3687, Fax 847-758-3686, ej@c-i-a.com